
Who Has The Advantage?
Buyers Have More Negotiating Power
8.3 months
Months Of Homes For Sale
If no new homes came up for sale, it would take about 8.3 months to sell the homes currently available.
Real estate term: Months of Supply
Licensed Florida Real Estate BrokerageIntegrated Closing ServicesMLS AccessBuy With or Without an Agent
34472 Real Estate Market
Real numbers from your local market. Explained for regular people.
As of September 27, 2026
475
Homes For Sale
Active inventory buyers can choose from
29
New This Week
Listings newly added to the market
38
Price Changes
Homes that changed price this week
26
Went Under Contract
Homes that found a buyer this week
0
Back On Market
Homes returned for sale this week

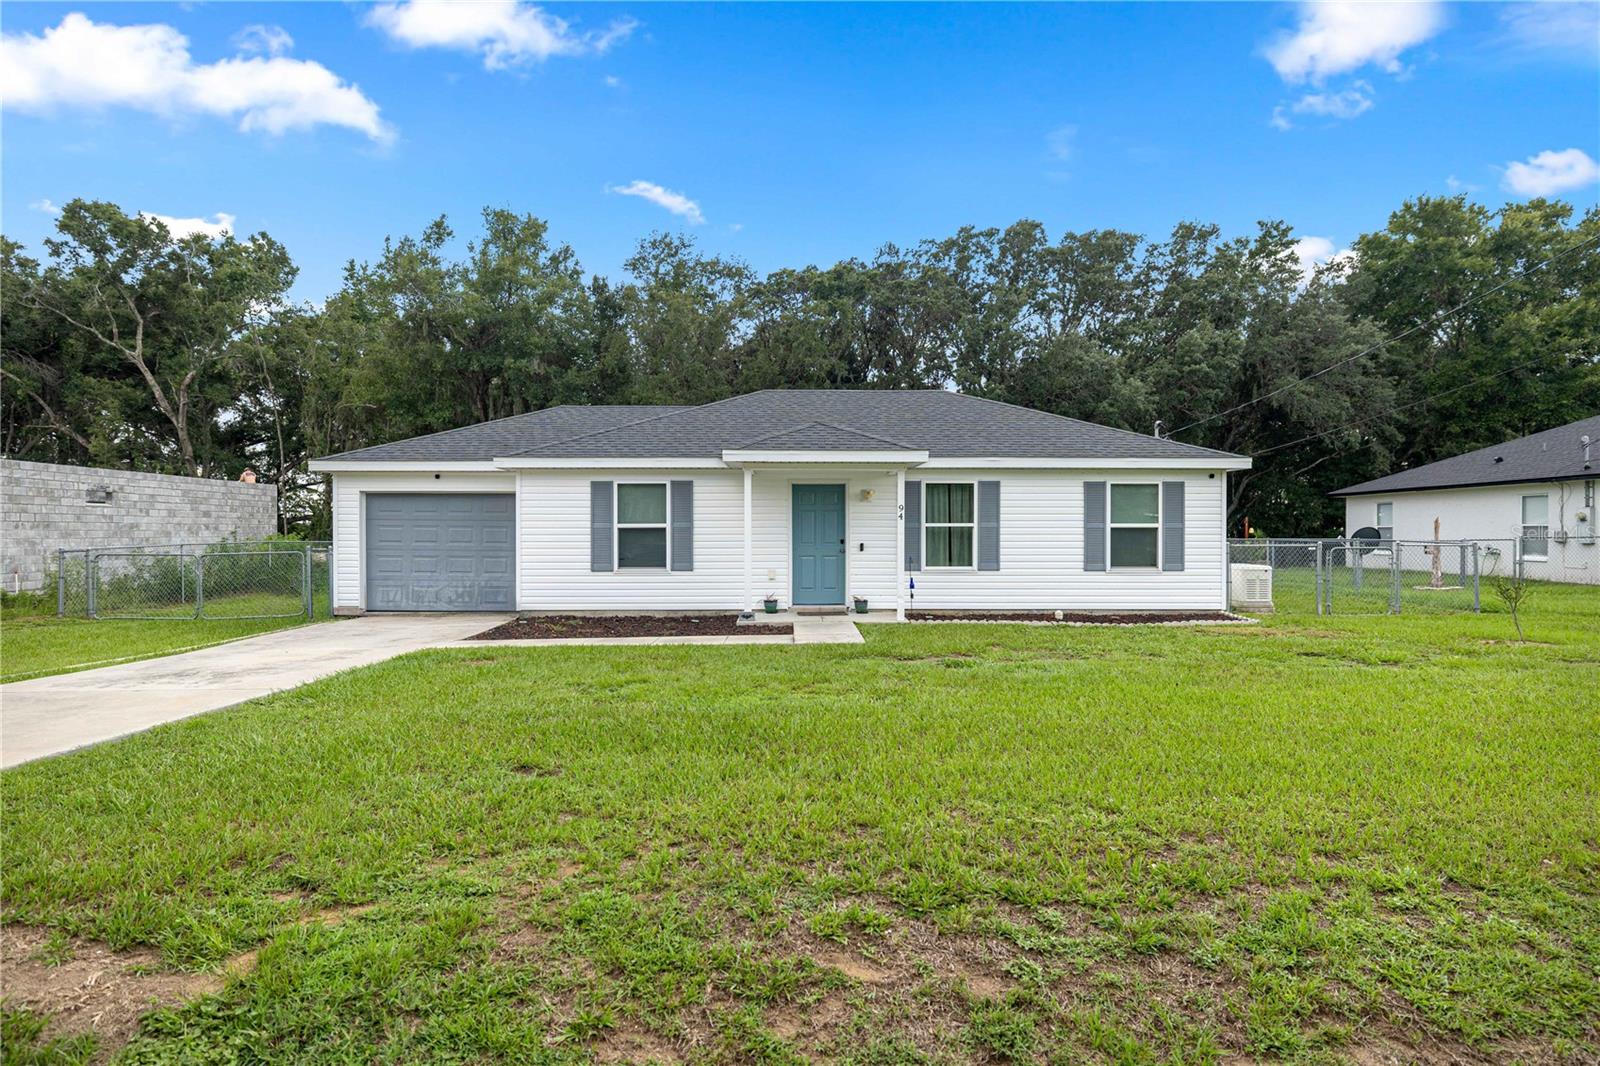
94 Willow
Ocala, FL 34472
3 bd · 2 ba · 1,014 sq ft
Single Family
$217 per sq ft · No HOA

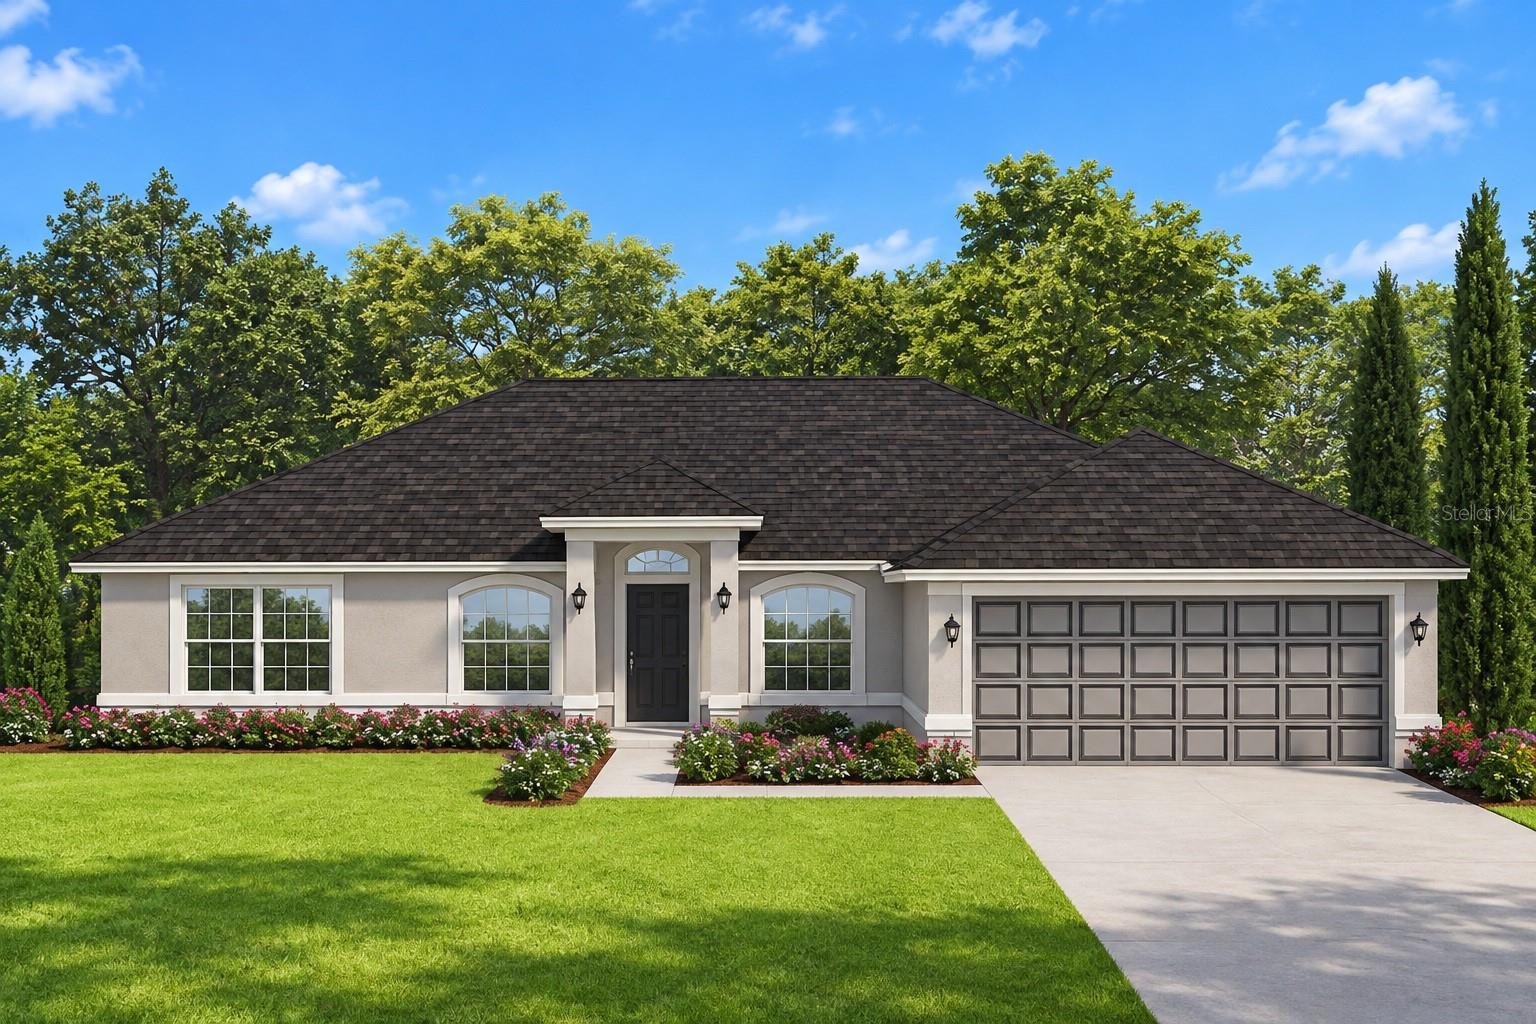
105 Pecan Course
Ocala, FL 34472
3 bd · 2 ba · 1,860 sq ft
Single Family
$171 per sq ft · No HOA

523 Bahia Circle
Ocala, FL 34472
3 bd · 2 ba · 1,571 sq ft
Single Family
$204 per sq ft · No HOA

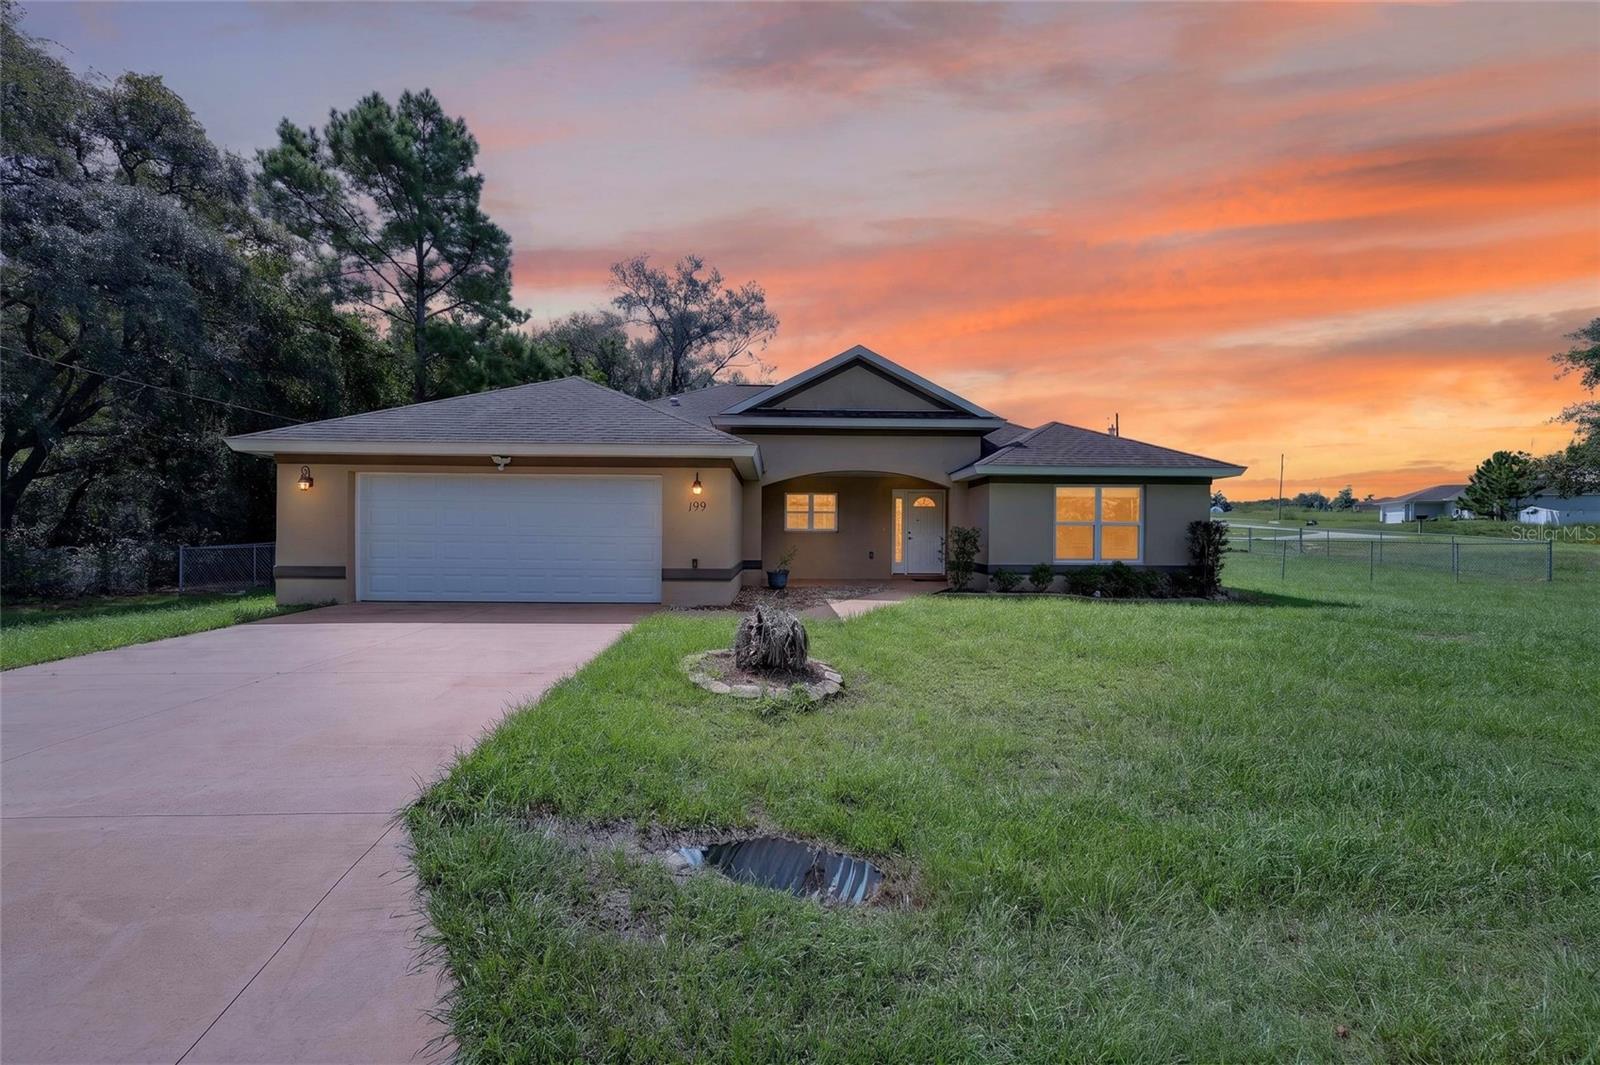
199 Oak Lane
Ocala, FL 34472
3 bd · 3 ba · 1,847 sq ft
Single Family
$171 per sq ft · No HOA

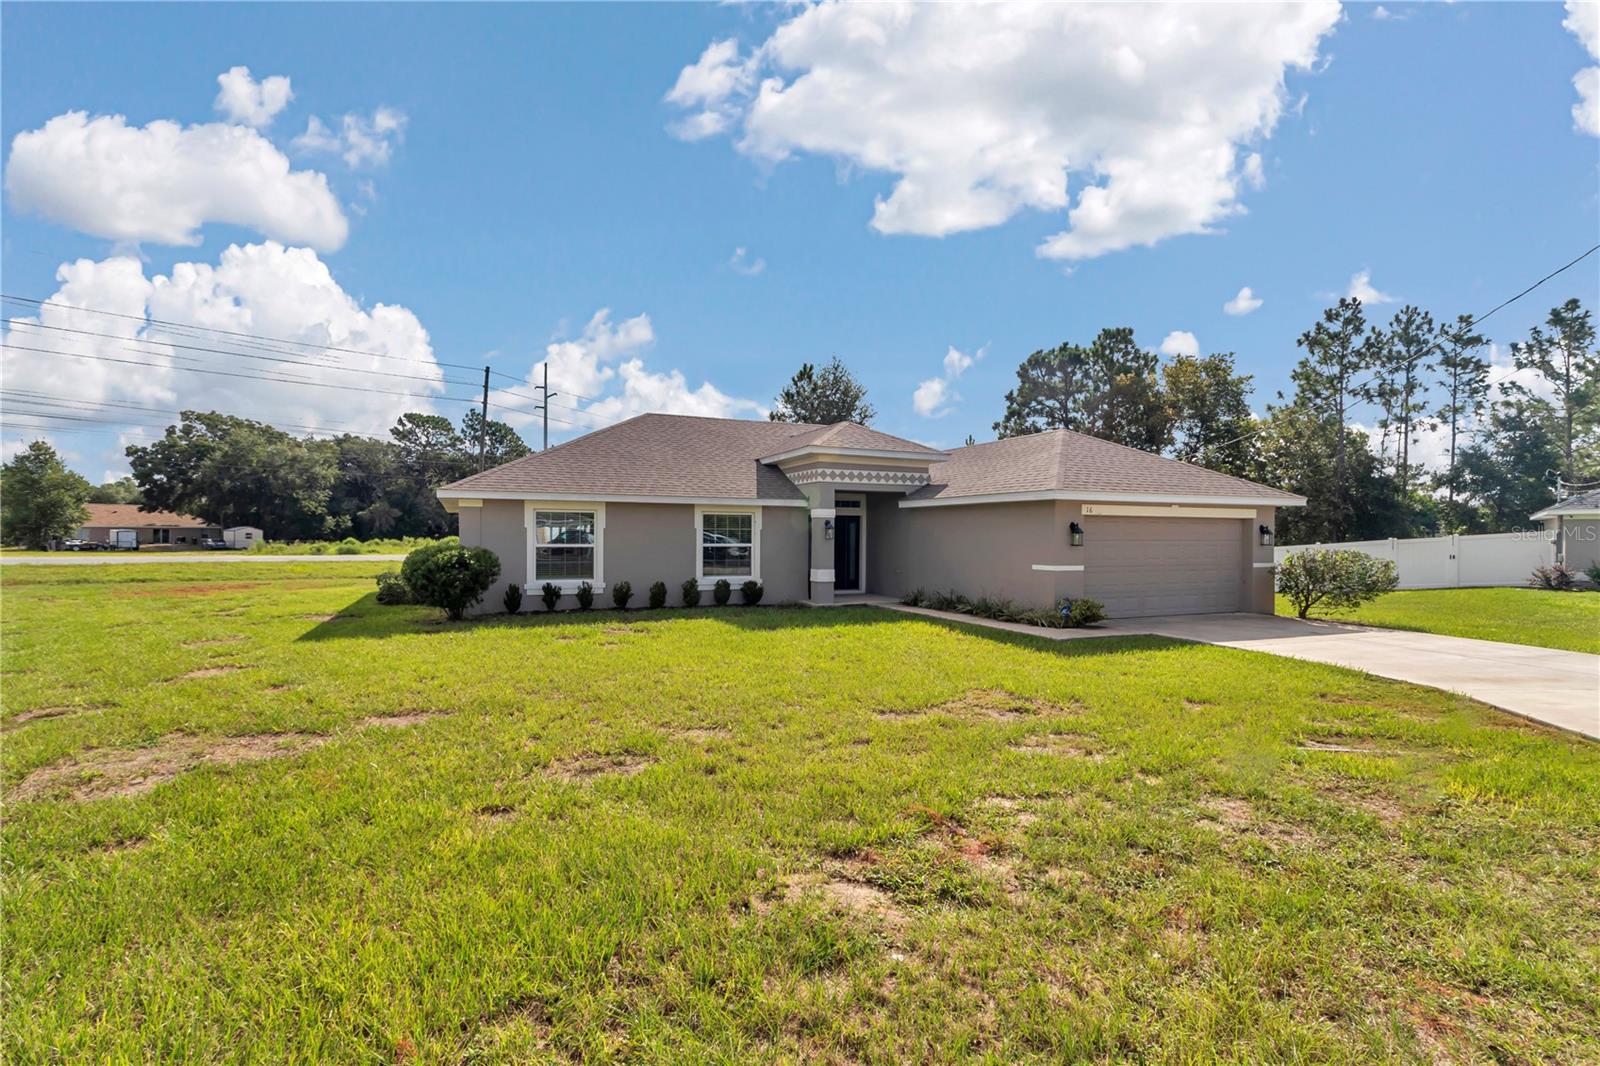
16 Spring
Ocala, FL 34472
3 bd · 2 ba · 1,725 sq ft
Single Family
$182 per sq ft · No HOA

223 Locust
Ocala, FL 34472
3 bd · 2 ba · 1,331 sq ft
Single Family
$180 per sq ft · No HOA

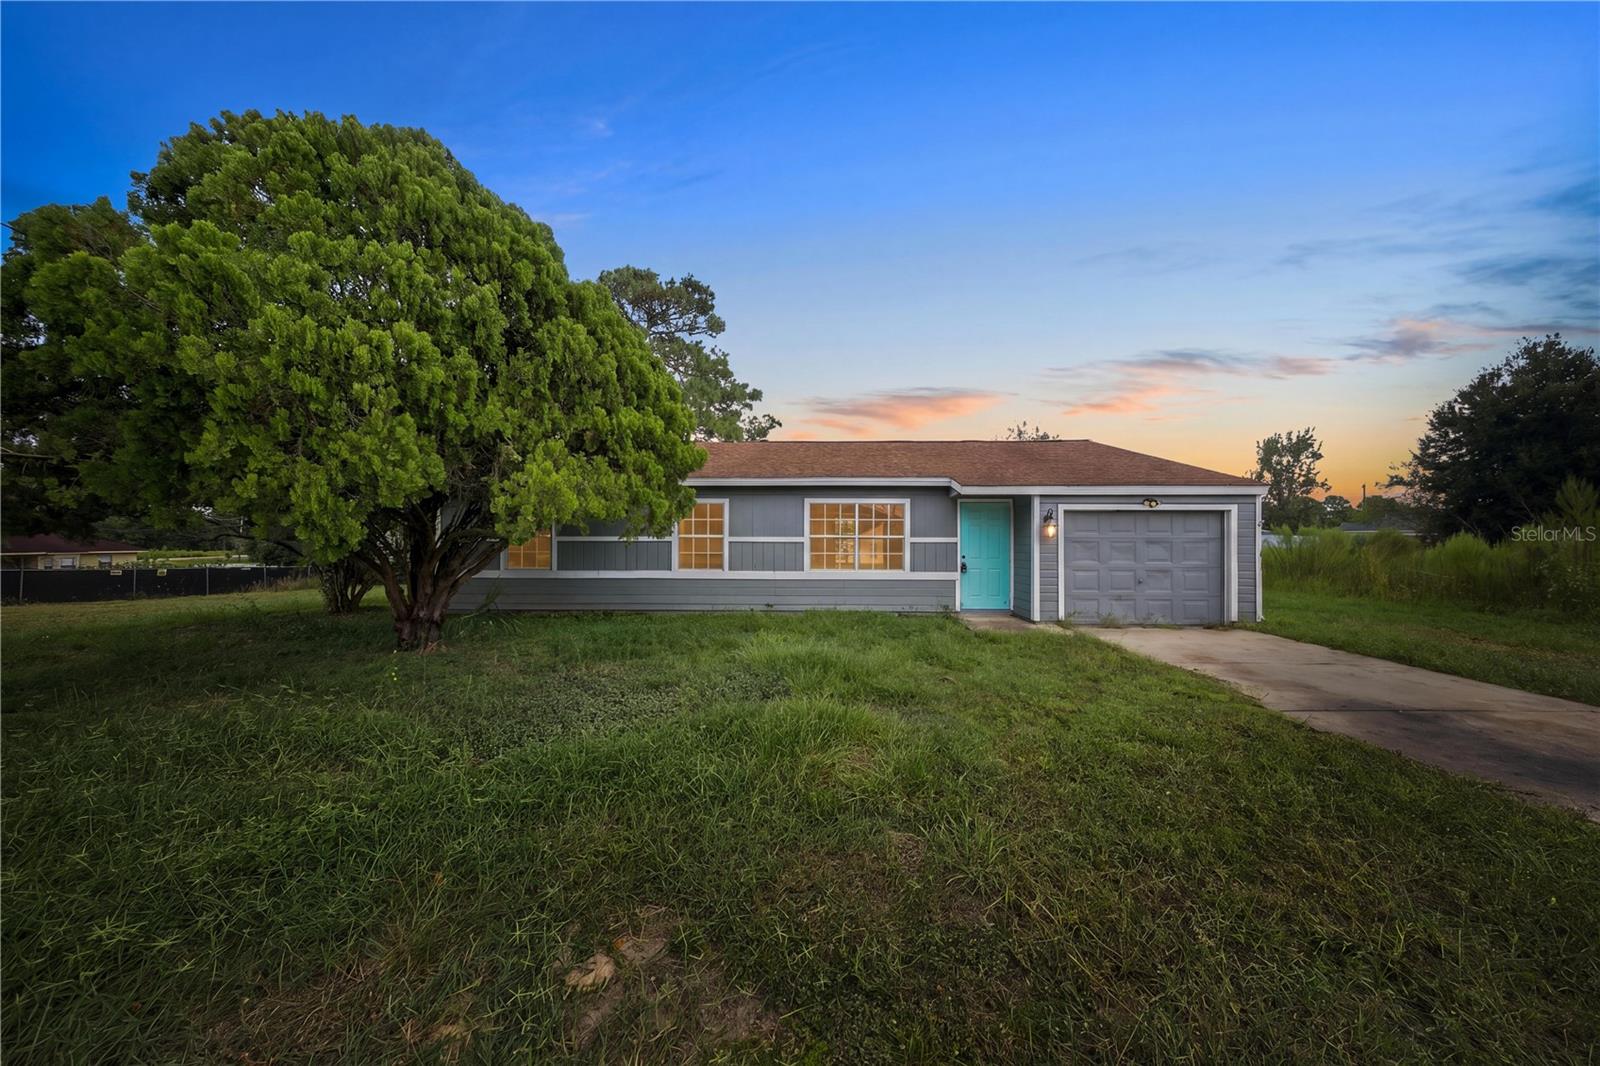
24 Cedar
Ocala, FL 34472
3 bd · 2 ba · 1,116 sq ft
Single Family
$143 per sq ft · No HOA

13 Locust
Ocala, FL 34472
3 bd · 2 ba · 1,352 sq ft
Single Family
$170 per sq ft · No HOA
Data courtesy of Stellar MLS as distributed by MLS GRID as of Sep 26, 2026 6:01 AM ET through Sep 27, 2026 6:01 AM ET.
Buyers Have More Negotiating Power
8.3 months
Months Of Homes For Sale
If no new homes came up for sale, it would take about 8.3 months to sell the homes currently available.
Real estate term: Months of Supply
$238,000
Typical Sale Price
$178
Typical Price Per Sq. Ft.
99.4%
Of Asking Price
At this ZIP's typical close-to-list ratio, a home listed at $500,000 would have sold for about $497,000.
54 days
Typical Time To Sell
6.3%
Share Of Homes Listed Before
Some homes are relisted, which restarts the clock on most sites. This counts total time on market.
As of September 27, 2026
45.1%
Of Homes For Sale Are Below Their Original Asking Price
38
Price Changes This Week
122
Price Changes In The Last 30 Days
8.0%
Share Of Inventory That Changed Price This Week
$10,000 (5.9%)
Typical Reduction Among Reduced Listings
More sellers changing their asking price can be a sign that buyers are being selective.
A Balanced Market
5.3 months
Months Of Homes For Sale
If no new homes came up for sale, it would take about 5.3 months to sell the homes currently available.
Real estate term: Months of Supply
$243,000
Typical Sale Price
$179
Typical Price Per Sq. Ft.
99.6%
Of Asking Price
At this ZIP's typical close-to-list ratio, a home listed at $500,000 would have sold for about $498,000.
53 days
Typical Time To Sell
7.3%
Share Of Homes Listed Before
Some homes are relisted, which restarts the clock on most sites. This counts total time on market.
As of September 27, 2026
48.3%
Of Homes For Sale Are Below Their Original Asking Price
30
Price Changes This Week
93
Price Changes In The Last 30 Days
10.5%
Share Of Inventory That Changed Price This Week
$10,000 (5.0%)
Typical Reduction Among Reduced Listings
More sellers changing their asking price can be a sign that buyers are being selective.
As of September 27, 2026
$255K -> $262.5K Up 2.9% over the last 12 months
The typical sale price moved from $255,000 in Sep 2025 to $262,450 in Aug 2026, up $7,450.
Buyers Have More Negotiating Power
22.2 months
Months Of Homes For Sale
If no new homes came up for sale, it would take about 22.2 months to sell the homes currently available.
Real estate term: Months of Supply
4.1%
Share Of Homes Listed Before
As of September 27, 2026
41.9%
Of Homes For Sale Are Below Their Original Asking Price
5
Price Changes This Week
15
Price Changes In The Last 30 Days
6.8%
Share Of Inventory That Changed Price This Week
$10,000 (8.9%)
Typical Reduction Among Reduced Listings
More sellers changing their asking price can be a sign that buyers are being selective.
As of September 27, 2026
$120K -> $100K Down 16.7% over the last 12 months
The typical sale price moved from $120,000 in Sep 2025 to $100,000 in Aug 2026, down $20,000.
As of September 27, 2026
| Metric | 34472 Now | Last Year | Ocala |
|---|---|---|---|
| Homes For Sale | 475 | 392 | 4,274 |
| Typical Sale Price | $238,000 34472 is 15.8% lower | $242,857 | $282,642 |
| Homes Sold, 30 Days | 50 | 56 | 512 |
As of September 27, 2026, homes in 34472 had 8.3 months of supply, compared with 7.3 months across Ocala as a whole. The typical home here took 54 days to sell, against 67 days citywide.
Not every home is the same, so if more large or expensive homes sell in a given month, the typical sale price can rise even when the market has not really changed.
1,401 sq ft
Typical Size Of Homes Sold
22.0%
New Construction
Mix By Property Type
The market statistics above describe all of ZIP code 34472. Enter your property address in Ocala, FL for a property-specific estimate based on your home, not the blended ZIP averages.
Property Address
We use Google Places to find and verify your property.
Address suggestions are still loading. You can keep typing.
Select a property address and choose what brings you here to continue.
No, 34472 currently favors buyers more than sellers right now. As of September 27, 2026, 34472 shows 8.3 months of supply and 475 active listings, conditions typical of a buyer's market in Ocala. Individual results still depend on pricing, condition, and location within the ZIP code.
The typical home in 34472 took 54 days to sell as of September 27, 2026, counting total time on market including any earlier listing periods for the same property. That figure reflects recent closed sales in Ocala, not just the homes currently listed for sale in the ZIP code today.
Homes in 34472 sold for about 99.4% of asking price as of September 27, 2026, based on the median close-to-list ratio over the last 30 days, meaning a home listed at $500,000 typically sold for about $497,000. That figure includes homes that sold above list and below list within ZIP code 34472.
34472 is currently a buyer's market as of September 27, 2026, with about 8.3 months of supply and 475 homes currently for sale. Months of supply compares active inventory to recent sales, and values below about 4 months generally favor sellers while values above about 6 months favor buyers in Ocala.
Home prices in 34472 were down 2.0% year over year as of September 27, 2026, comparing the median sale price from the last 90 days with the same period a year earlier. Monthly swings can differ, but that figure shows the broader price direction for closed sales in ZIP code 34472.
As of September 27, 2026, there are 475 homes for sale in ZIP code 34472, representing active MLS listings buyers can shop today. That count shifts weekly as new listings arrive and others go under contract, so check back for the latest inventory in the ZIP code.
Selling a home in 34472 through HomeJam starts at $499 for the DIY tier, with Guided at 1 percent and Concierge at 2.5 percent of the sale price. Your total cost depends on which tier you choose plus other transaction expenses such as title, taxes and any concessions you agree to.
Market statistics are calculated using MLS data for ZIP code 34472.
Data is updated weekly. Last updated September 27, 2026.
Data courtesy of Stellar MLS as distributed by MLS GRID as of September 1, 2025 through September 27, 2026.
We use cookies and similar tools to remember how you found us, keep a session identifier, and understand which property pages you view. You can accept this use or decline optional tracking. See our privacy notice.